
By Clayton Handleman
 Featured on CleanTechnica.com
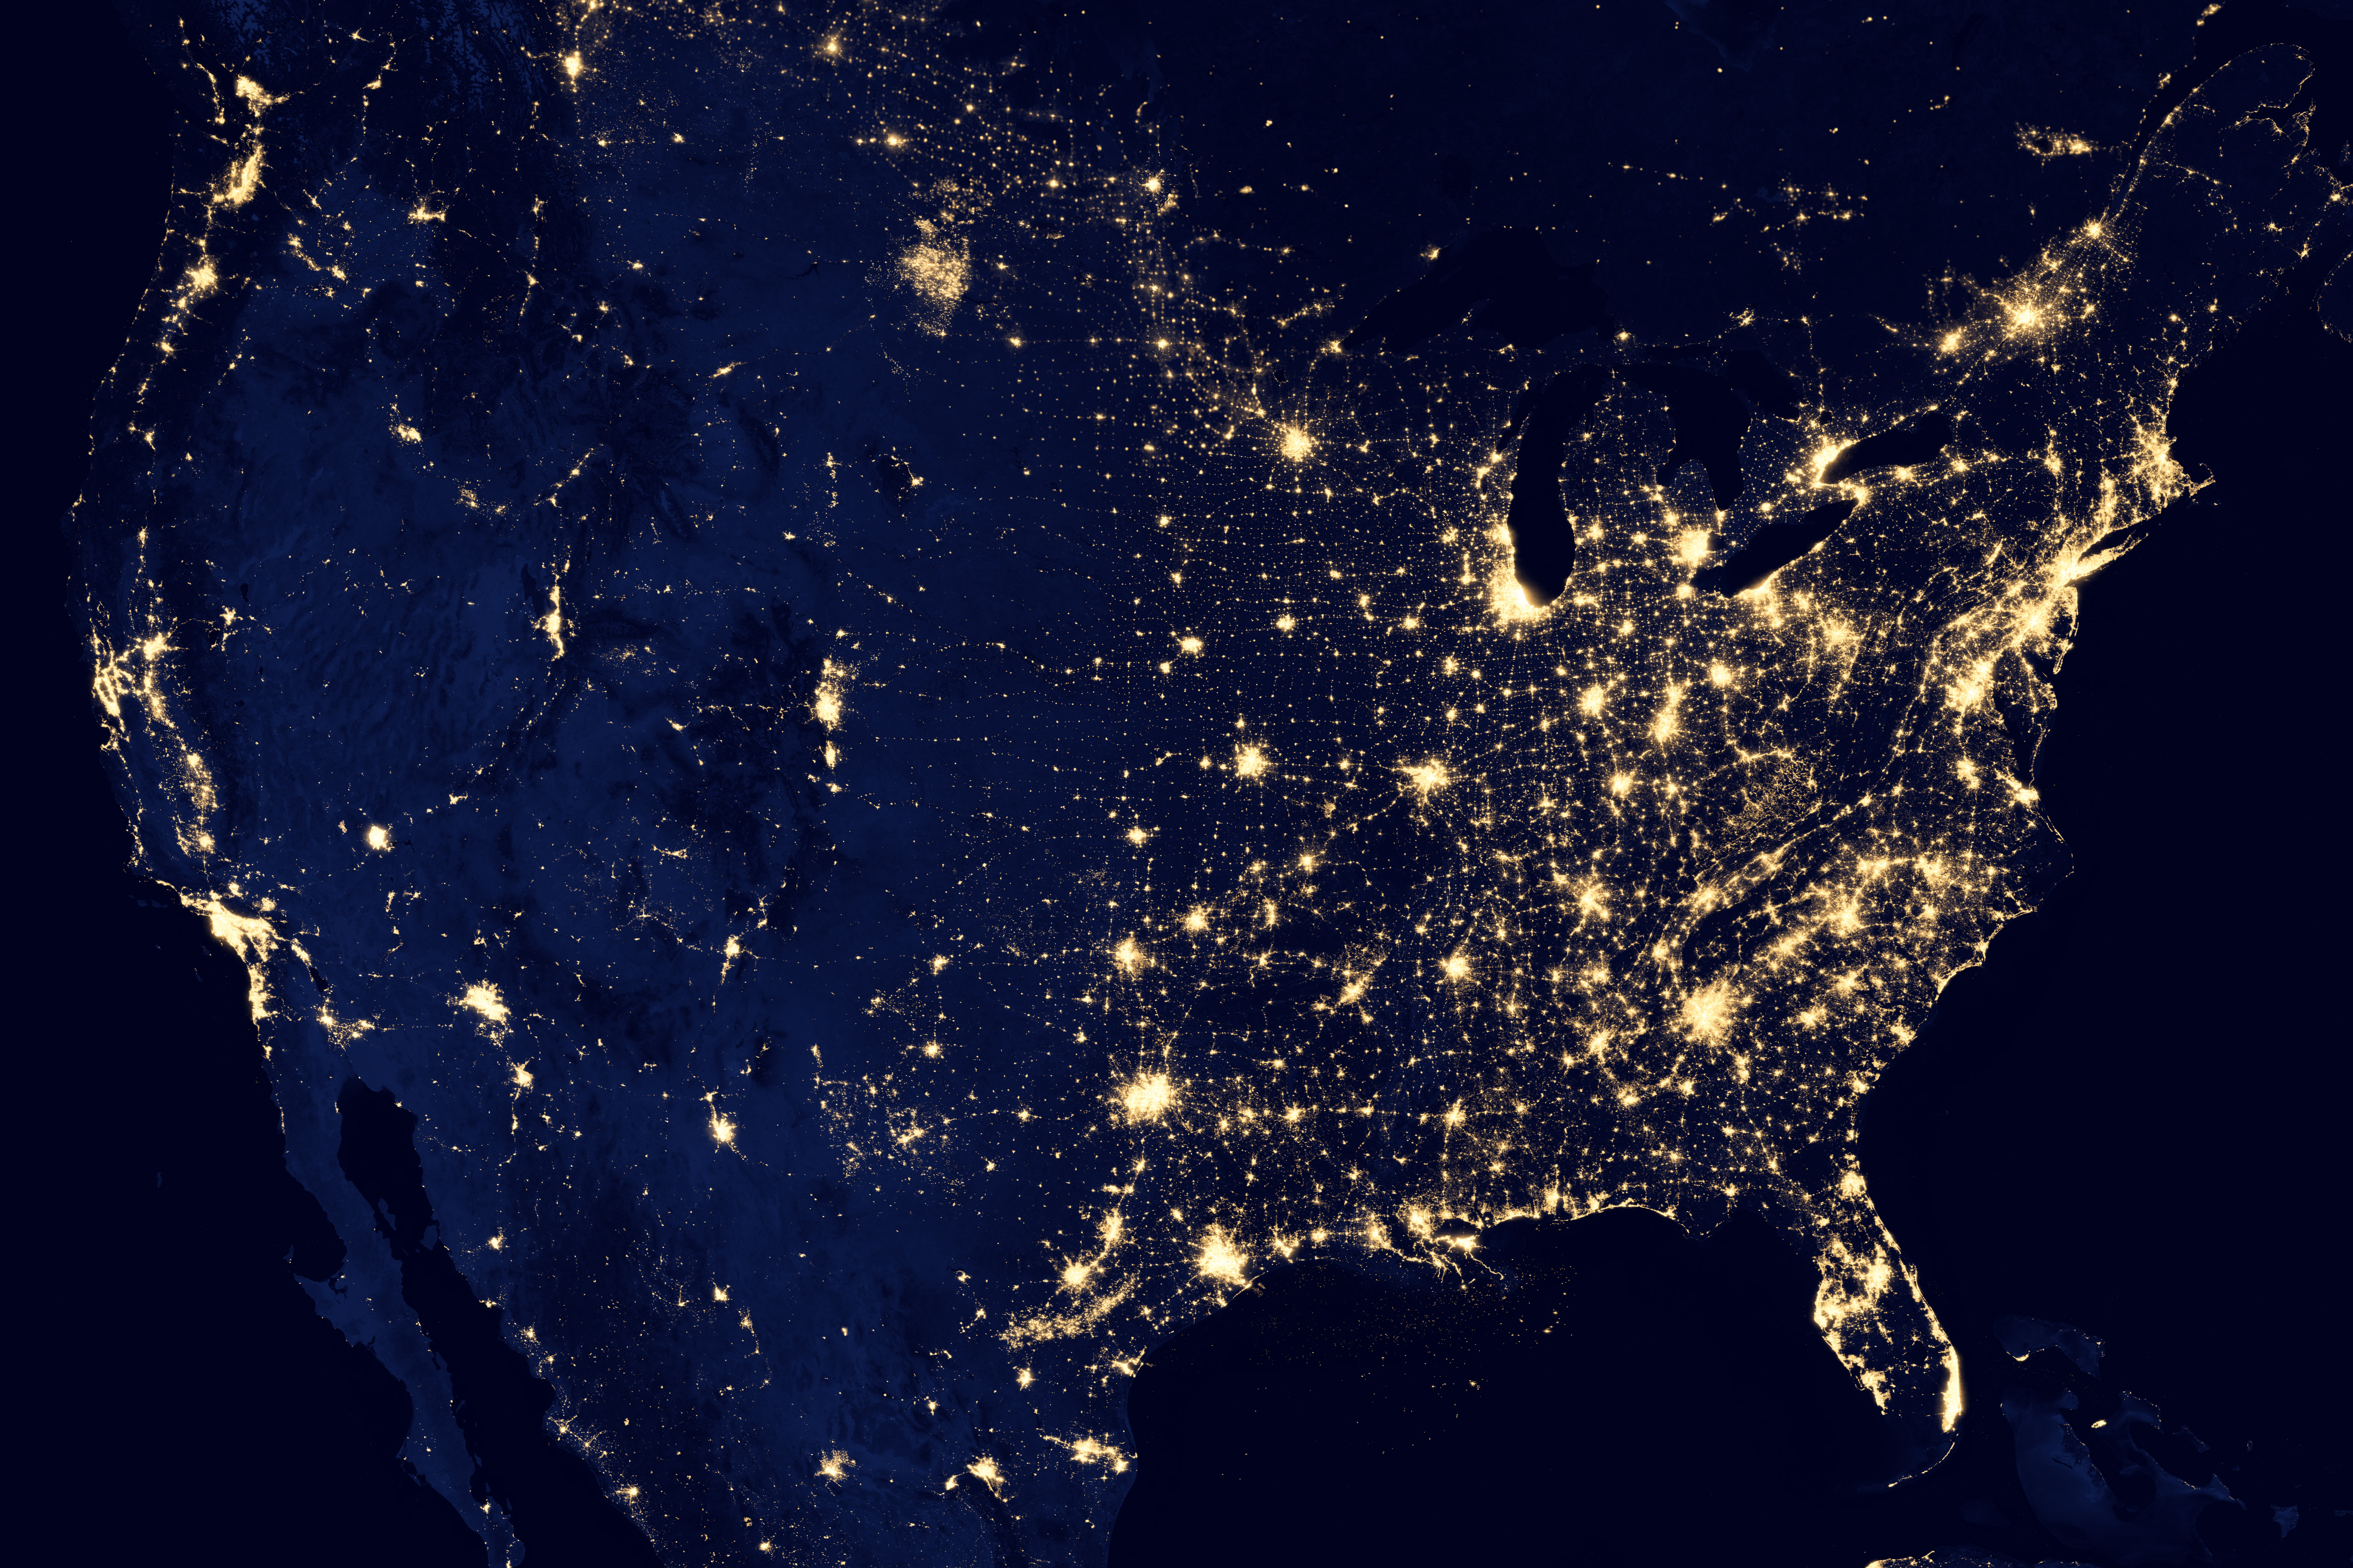
Wind is widely considered the most environmentally friendly source of electrical generation available. It is no secret that the wind resource in the Great Plains states is extraordinary, so much so that wind energy professionals have dubbed this region the “Saudi Arabia” of wind. The wind blows strong and steady. On an energy basis, Texas alone could provide all of the electricity needs of the entire country (Table 1). But the largest loads, seen here and here are concentrated on the East Coast, far from the Great Plains states. There is relatively little transmission line access to the best wind resources in the country. Bringing transmission access out to these massive sources would dramatically increase the availability of low cost, high quality, wind power for loads on the East Coast. While not comprehensive, this post provides an easy to understand overview of the geography of wind and transmission in the US exposing the opportunity and inviting the discussion of how to unlock this extraordinary resource.
 Table 1: Showing the Top 11 States in Terms of Wind Generation Potential. For perspective, the 2012 annual US energy consumption was 4,048 TWhr and peak demand was 1,063 GW.
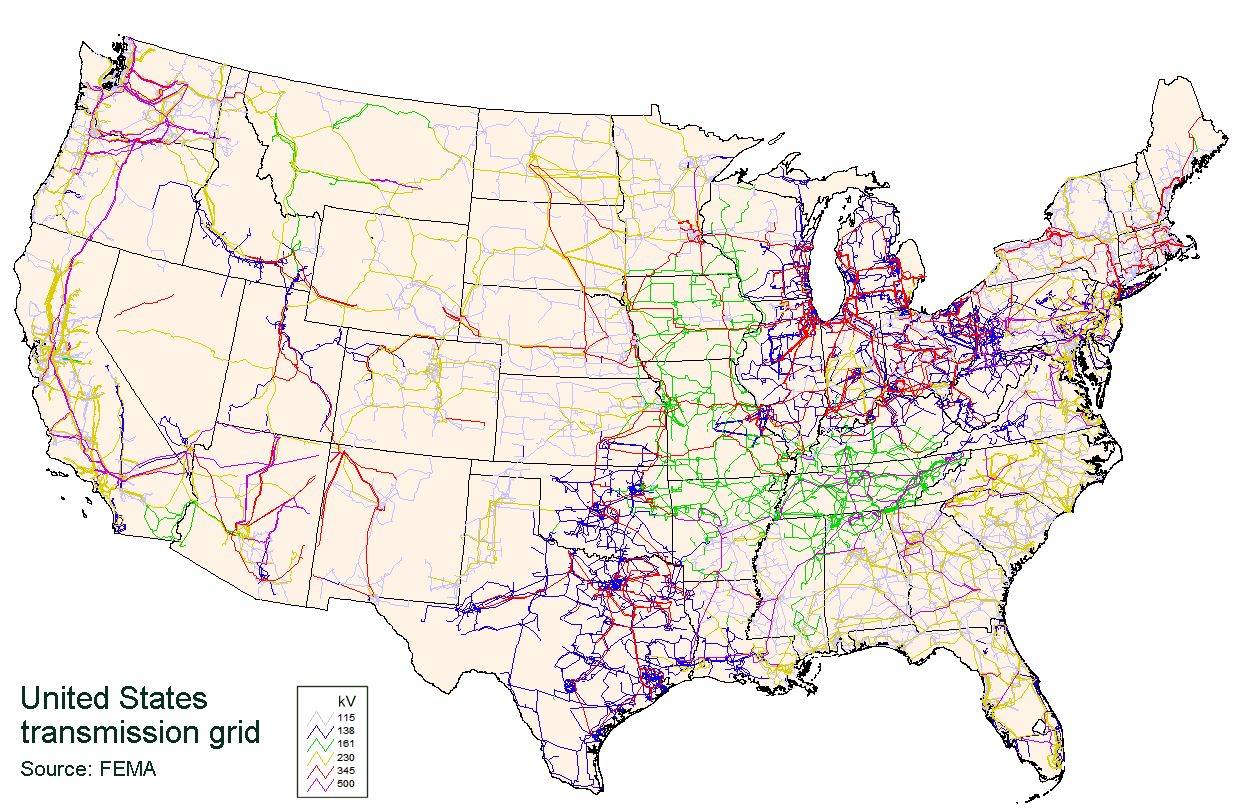
Maps 1a and 1b below provide a stark visual to bring into relief the lack of transmission access in areas of extraordinary wind resource. Map 1b shows the location and voltages of the nation’s transmission lines. Map 1a shows the average wind speed at 100m, the hub height of some of the largest wind turbines.
Before going on it is helpful to comment on a few things about power transmission lines (see the map from which map 1b was derived here). Efficiency goes as the square of voltage. So every doubling of voltage increases the efficiency and carrying capacity of a transmission line by about 4 times. So 500kV lines are about twice the efficiency and carrying capacity of 345kV lines of comparable conductor size. This is evident in the extensive use of 345kV lines in the East and Midwest contrasted with large corridors of 500kV lines connecting the considerable hydroelectric assets Oregon with the power hungry areas around LA and San Francisco. However, even that is not equivalent to the task of moving 100’s of GWs 1500 miles from the prime Great Plains sites to the Eastern Seaboard. That will require even higher voltage 765kVac lines and / or 800kWDC transmission lines.
 1a 1b
1a 1b
Maps 1a and 1b: The Wind Resource Map (WRM) above left shows the wind resources in the central US. You can click here to see that map expanded to the entire US. Above right is a Transmission Line Map (TLM) showing the grid in the central US. Click Map of Grid to see a grid map of the entire USA. Notice that the circled areas correspond to ideal, high CF areas but little or no transmission lines to those sites.
Map 1a at left above shows the wind resource at wind turbine hub heights of 100m. For perspective, the average hub height in 2012 was just over 80 meters. Notice the area in the Northwestern part of Nebraska with the high resource, blue shading, representing wind speeds above 9 m/s. There are similar resources in Southwestern Kansas and Northern Texas. However, interestingly, the wind resource in Minnesota and Iowa is not as good with almost none of the blue. And while that may seem like a small difference it is important to recall that the power in wind goes as the cube of the wind speed. All other things equal, the impact of this cubic relationship is that 9 m/s wind has 42% more power than 8m/s wind.*
The circled areas on the map 1b correspond to the high wind areas described above. If you compare the circled areas on map 1b to their counterparts on map 1a it is clear that these premium areas have very little transmission access. For example the amazing resource in Cherry County in North central Nebraska has no transmission lines reaching it and those at its edges are a mere 110kV which would be totally overwhelmed by even a single moderately sized windfarm. Southwestern Kansas is not much better. However, other than transmission access, these areas are ideal for wind development.
The circled areas in Nebraska and Kansas have phenomenal wind resources each with hundreds of GW of potential at and above 50% capacity factor. Most of the land in these areas is agricultural and ranch land which has proven to be very symbiotic with wind. There is little concentrated population so NIMBY is of little to no concern. In Nebraska the economy of that area is quite poor so high paying wind related jobs would likely be welcomed. Further the wind industry would likely be welcomed as they trained the locals. Finally, if transmission were brought to this area at scale commensurate with the resource, manufacturing would be built in the area. Among the many advantages, transportation of the massive wind turbine parts would be rendered comparatively easy for the newest generation of tubines with towers of hub heights in the 100m to 135m class. The roads are long and straight, the terrain is relatively flat and there is little traffic in such a low population density area. Also the land is relatively inexpensive, particularly in NE as can be verified with a google search of ‘Cherry County Nebraska Real Estate.’
 Map 2: Above is a map showing the location of wind farms in the central US as of 2012. Notice that there is a relatively minimal build-out in the high wind areas of Kansas and Nebraska which happen also to have very poor grid resources. Click here to see an expanded version of this map that includes the entire US. for. It also has a dynamic feature that enables you to see the historical increase in wind farms throughout the US.
The importance of transmission access is easily seen by looking at where wind is being developed in the central US. A glance at Map 2 shows that considerably more wind development has occurred in Iowa and Minnesota than in Kansas and Nebraska despite the significantly better wind resource in the latter two states. Minnesota and Iowa have denser, higher capacity transmission and are closer to population centers such as Minneapolis St. Paul and Chicago. In Oklahoma, again, most of the build-out trades off capacity factor for transmission access. And in Texas, there has been a substantial slow down in building out wind resource until transmission is built out to accommodate it. It is noteworthy that Texas’s experience with wind has been sufficiently positive that they are choosing to build additional transmission sufficient to both increase utilization of existing wind and to accommodate further wind development.
It is clear that there is an enormous disconnect between transmission access and the best wind resources. With improved, intentional development of the transmission access, we could move from wind farms of convenience, which sacrifice capacity factor for load access, to those that are optimally sited. The wind resource map for 100m hub heights (1a) came out after several major wind studies, such as EWITS, had frozen their data sets. It shows that there is extraordinary untapped opportunity that can raise the average capacity factor by roughly 40% from that used in a number of influential studies. Given advancing developments in high voltage DC, commercially available wind turbines with high capacity factor along with high hub heights in excess of 100m, it is time to revisit the economics of bringing the Supergrid from the east coast to the central great plains.
 Map 3: This map provides location and capacity data for US wind power.
* In practice, all other things are not equal. The statistical distribution of wind speeds must be taken into account, among other. The reason for pointing that out is to clarify that there are nonlinear improvements to be had by relatively small increases in wind speed and that remains true even after taking into account other considerations.
Latest NREL data shows 65% Capacity Factor wind available in Great Plains states using 140 m turbine towers.
Lots of great info here debunking myths and clarifying how wind power works.
Bloomberg recently published this showing the increasing competitiveness of wind power.
Nice piece on underground HVDC superhighway
UPDATE: March 25: Clean Line is getting backed by the federal government to move forward with HVDC from LK to TN. More Here.
UPDATE: This map shows the wind resource at 120 m
grid, supergrid, wind, capacity factor, CF, intermittent source, wind farm, wind farms
This USGS Site shows where many of the US wind turbines are located.
This site tracks progress in expanding transmission access in the Great Plains region.
The Grainbelt Express may be the catalyst that gets things moving forward:
Prairie Wind Transmission – a 345kV grid expansion for KS
Good article on KS wind and power transmission resources.
21st Century Interstate Electric Highway System
Moving in the right direction – Solar 500kV line Here.
High penetration can be done without adding storage Here .
Super Grid is Super Important for renewables! – Link Here
Cost of renewable energy follows the relentless experience curve .
Tall towers and better siting offer potential to power US with 50% CF wind.
Improved capacity factors continue to improve the value proposition of wind. (Cleantechnica)
Next generation Super Turbines offer glimpse into a 50%+ CF future =
Oklahoma may get HVDC to move wind power from the pan handle to high demand markets- Here .
The Super Grid is Super Important for renewables – Part I of a three part piece on how a super grid can help aggregate renewables and reduce intermittency.
Report / Presentation on the Silent Wind Revolution in wind power is summarized HERE. This examines how relatively low wind, previously uneconomical, sites have become economical in light of the new NREL data and improved turbine technology.
An interesting article on wind power in WY combined with storage and sending power to CA HERE . Pathfinder project referred to by some as the new hoover dam.
Clayton Handleman
Wind Energy News, Wind Power News, wind news, grid, supergrid, wind, capacity factor, CF, intermittent source, wind farm, wind farms

This is a great summary of a continuing improvement. Greater production is creating lower prices, lower prices mean more customers and more windfarms.
These capacity factors mean that the new transmission will have higher utilization rates. That will solve the transmission dilemma!
LikeLike
Pingback: With 50% Capacity Factors, Wind Has Reached the Tipping Point | The Handleman Post
Pingback: Superturbines Open the Door to New Era for Wind Power | The Handleman Post
Pingback: The Way the Future Blogs, an online memoir by science fiction writer Frederik Pohl » Blog Archive » An Ill Wind Blows No Power Eastward
Great peace of work.
LikeLike
Pingback: The ‘Super Grid’ is Super Important for Renewables Part I | The Handleman Post
Pingback: Resource Maps | The Handleman Post
Pingback: Some Informative Links From This Blog | The Handleman Post
Pingback: Handleman Post Greatest Hits | The Handleman Post
Pingback: Electric Vehicles Are Great Match to Wind in Many Areas | The Handleman Post
Pingback: EVs Are a Good Match for Renewables Part II | The Handleman Post
Pingback: New NREL Numbers Suggest Wind Power Could Shed Intermittent Reputation | The Handleman Post
Pingback: Wind Could Replace Coal As US’ Primary Generation Source, New NREL Data Suggests | ecoiko.eu Cyprus Green Eco Energy Resource Centre and Directory
Pingback: Wind Could Replace Coal As US’ Primary Generation Source, New NREL Data Suggests | Enjeux énergies et environnement
Pingback: Wind could replace coal as US primary generation source: NREL : Renew Economy
Pingback: Wind could replace coal as US primary generation source: NREL | Enjeux énergies et environnement
Pingback: NREL says wind could replace coal as primary generation source for US : Renew Economy
Pingback: Wind Could Replace Coal As US’ Primary Generation Source, New NREL Data Suggests