Many suggest that renewable energy gets an unfair break because it is subsidized. However they often fail to realize that fossil fuels and nuclear are also subsidized. Further, they have other costs that are not reflected in their price. In other words, they are paid for elsewhere. An example is that we pay for damage to health, due to pollution from coal plants, through our health insurance premiums and NOT through our electricity bill. These are external costs or Externalities. In a true free market, all related costs would be reflected in our electric bill.
UPDATE June 2015: More recent study that includes externalities (pg ix) in Europe
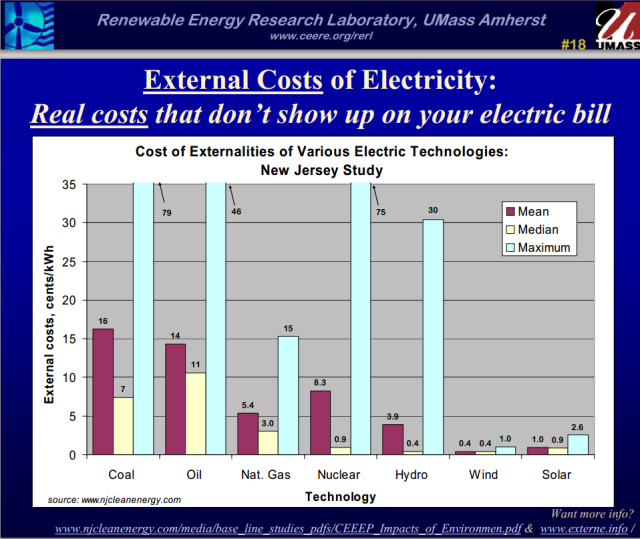
Another example is that much of the risk for Nuclear plants is pushed off to the tax payer. Some externalities are easy to assess and others are more subjective. There is a wide range of opinion as to what the true cost of externalities is though little dissaggrement that they exist and are not factored into pricing. Figure 1: provides a sense of the range of Externalities.
 Figure 1: Metastudy results showing the wide range of conclusions about externalities for various generation technologies.
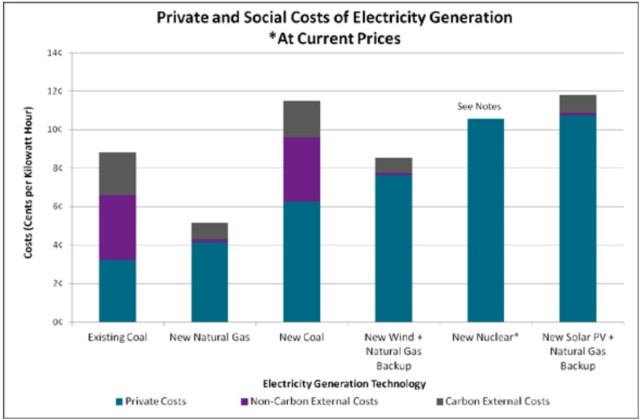
 Figure 2: Here is a piece from the Brookings Institution, that draws from a National Academies study, offering a comparison of the various energy sources with cost of energy + cost of externalities. This is a more conservative view and does not acknowledge that there is a pretty wide range of views on externalities.
UPDATE 2015: The IMF released a report on Global Energy Subsidies. It was reviewed at the blog, The Energy Collective and the reviewer reported that the IMF findings for Climate Change (CC) externalities were in good agreement with the average value found by other sources and were $35 / MWhr ($0.035 / kWhr. Findings for Local Air Pollution (LAP) were divergent with the IMF findings at $107 / MWhr while the average from others averaged out to $23 / MWhr (0.023 / kWhr).
When looking specifically at the large externality estimate related to coal, the IMF breaks it down into $78/ton for climate change and $239/ton for local air pollution. When considering a cheap and simple coal power plant operating at 35% efficiency combusting coal with a heating value of 23 GJ/ton, this is equivalent to costs of $35/MWh for climate change and $107/MWh for local air pollution. A search of the scientific literature on the subject revealed the following estimates for developing nations to which the bulk of coal damages are attributed. CC = climate change, LAP = local air pollution.
IMF – CC: $35/MWh, LAP: $107/MWh
India (2012) – CC: $35/MWh, LAP: $15/MWh
China (2015) – CC: $18/MWh, LAP: $54/MWh
Poland (2012) – LAP: $26/MWh
Chile (2013) – CC: $13/MWh, LAP: $5/MWh
Bosnia (2011) – LAP: $5-10/MWh
China (2007) – CC: $54/MWh, LAP: $36/MWh
Global (2007) – LAP: $16-30/MWh
Exhibit 1: Externalities related to climate change and Local Air Pollution. This data was compiled by Schalk Cloete, from This article published at The Energy Collective.
The Brookings study shows solar and wind as pretty highly priced in part because their position is that natural gas backup is required. However, in areas where solar peaks coincide with use peaks (which is common anywhere where air conditioning is used heavily) solar can actually reduce the need for gas peaking plants. Grid upgrades are needed with or without renewables. A robust grid favors renewables as it reduces intermittency due to local climates such as cloudy days or low wind speeds by spreading the renewable generation over a wider area. This leads to smoother power from the renewables and an effective base load. See this post for more on upgrading the grid to accommodate more renewables. The Solana solar plant, due to go online before the end of 2013, will use sunlight to heat steam to generate electricity. It will also heat salt which will then be used to make steam to generate electricity for 6 hours after the sun goes down. The Southwest has minimal cloud cover so this is a very predictable electricity source and dispatchable during the time of greatest need, i.e. the first few hours after sun down.
But for now, penetration of renewables is pretty low so there is headroom before peaking facilities need to be built to accommodate high renewables penetration. But if they are right that we do a heavy build-out of renewables without grid upgrades it is probably about right. If we are looking into the crystal ball to that point where high penetration occurs then they need to think about what grid enhancements will have occurred by then. In any event it is odd that there is the same greenhouse externality for solar as for straight natural gas. That is curious. It is even more curious that it is comparable for wind since we are seeing turbine capacity factors in excess of 40%. See here and here for more information on high capacity factor wind turbines.
Here is a report from NREL comparing lifecycle carbon intensity of various generation sources. And here is the overall report – http://www.nrel.gov/analysis/sustain_lca_results.html
Here are estimates by the EPA of the cost of Carbon alone without the other externalities factored in.

LOL Thanks for the post.
LikeLike
Pingback: Externalities of Nuclear Energy | The Handleman Post
Pingback: Pigovian Tax | The Handleman Post
Pingback: New NREL Numbers Suggest Wind Power Could Shed Intermittent Classification | The Handleman Post